OpenOCD is commonly used for on-chip debugging, but can also be used to easily program executables via CLI and VSCode.
Using the CLI
To program a binary executable, run the following command in your terminal:
openocd -f interface/stlink.cfg -f target/stm32wlx.cfg -c "program <binary-file-location> verify reset exit 0x08000000"
Some parts of the command above are optional:
verifyis used to verify the loaded firmware after programming;resetwill start the programmed executable without having to power cycle the device;exitquits OpenOCD as it will otherwise keep running to debug the chip.
0x08000000 signifies the starting address of the user program. If you do not wish to input this, you can also opt to program the elf file (with the .elf filename extension) using the following command:
openocd -f interface/stlink.cfg -f target/stm32wlx.cfg -c "program <elf-file-location> verify reset exit"
The binary file is extracted from this file during compilation of the Generic Node firmware, so it should not make a difference which file you use.
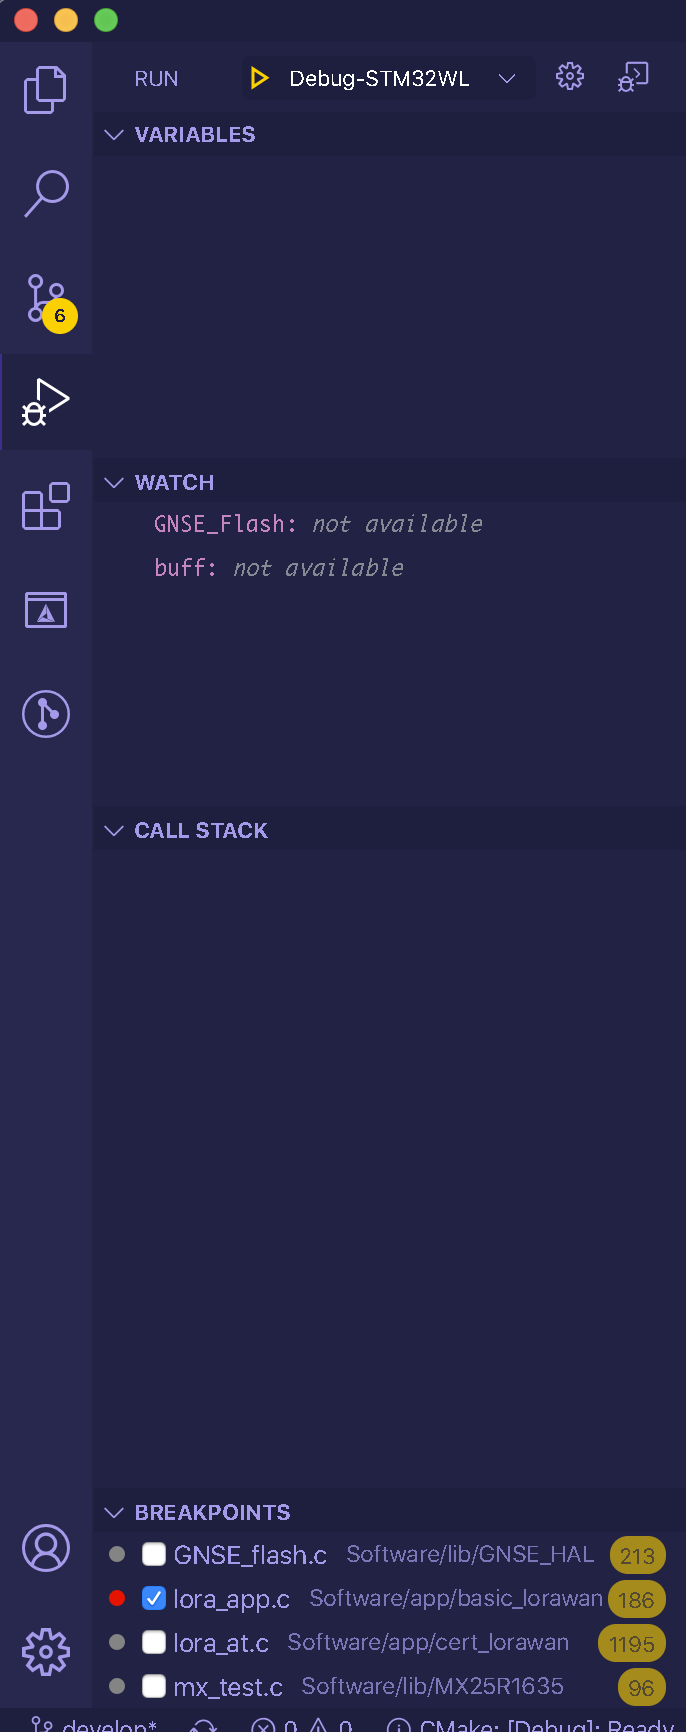
Using VSCode
OpenOCD can be used in combination with VSCode in order to flash and debug applications.
- Install Cortex-Debug
- Create
launch.jsoninside.vscodefolder and add the following lines:
{
    "version": "0.2.0",
    "configurations": [
        {
            "name": "Debug-STM32WL",
            "type": "cppdbg",
            "request": "launch",
            "program": "${workspaceRoot}/Software/build/debug/app/basic/basic.elf",
            "args": [],
            "stopAtEntry": true,
            "cwd": "${workspaceRoot}",
            "environment": [],
            "externalConsole": false,
            "debugServerArgs": "-f interface/stlink.cfg -f target/stm32wlx.cfg",
            "serverLaunchTimeout": 20000,
            "filterStderr": true,
            "filterStdout": false,
            "serverStarted": "Info\\ :\\ [\\w\\d\\.]*:\\ hardware",
            "setupCommands": [
                { "text": "cd ${workspaceRoot}/Software/build" },
                { "text": "file debug/app/basic/basic.elf", "description": "load file", "ignoreFailures": false},
                { "text": "target extended-remote localhost:3333", "description": "connect to target", "ignoreFailures": false },
                { "text": "monitor reset halt", "description": "perform a reset and halt the target", "ignoreFailures": false },
                { "text": "load", "description": "flash target", "ignoreFailures": false },
                { "text": "monitor reset init", "description": "perform a reset and init the target", "ignoreFailures": false },
                { "text": "set output-radix 16", "description": "set the default numeric base to 16", "ignoreFailures": false }
            ],
            "logging": {
                "moduleLoad": true,
                "trace": true,
                "engineLogging": true,
                "programOutput": true,
                "exceptions": true
            },
            "MIMode": "gdb",
            "miDebuggerPath": "/Users/UserName/opt/gcc-arm-none-eabi-6-2017-q2-update/bin/arm-none-eabi-gdb",
            "debugServerPath": "/usr/local/bin/openocd"
        }
    ]
}
Note:
You need to update “program” and “setupCommands” fields with the application you plan to flash and debug.Note:
You need to update “miDebuggerPath” and “debugServerPath” fields with the system paths of your tool chain gdb and OpenOCD binary.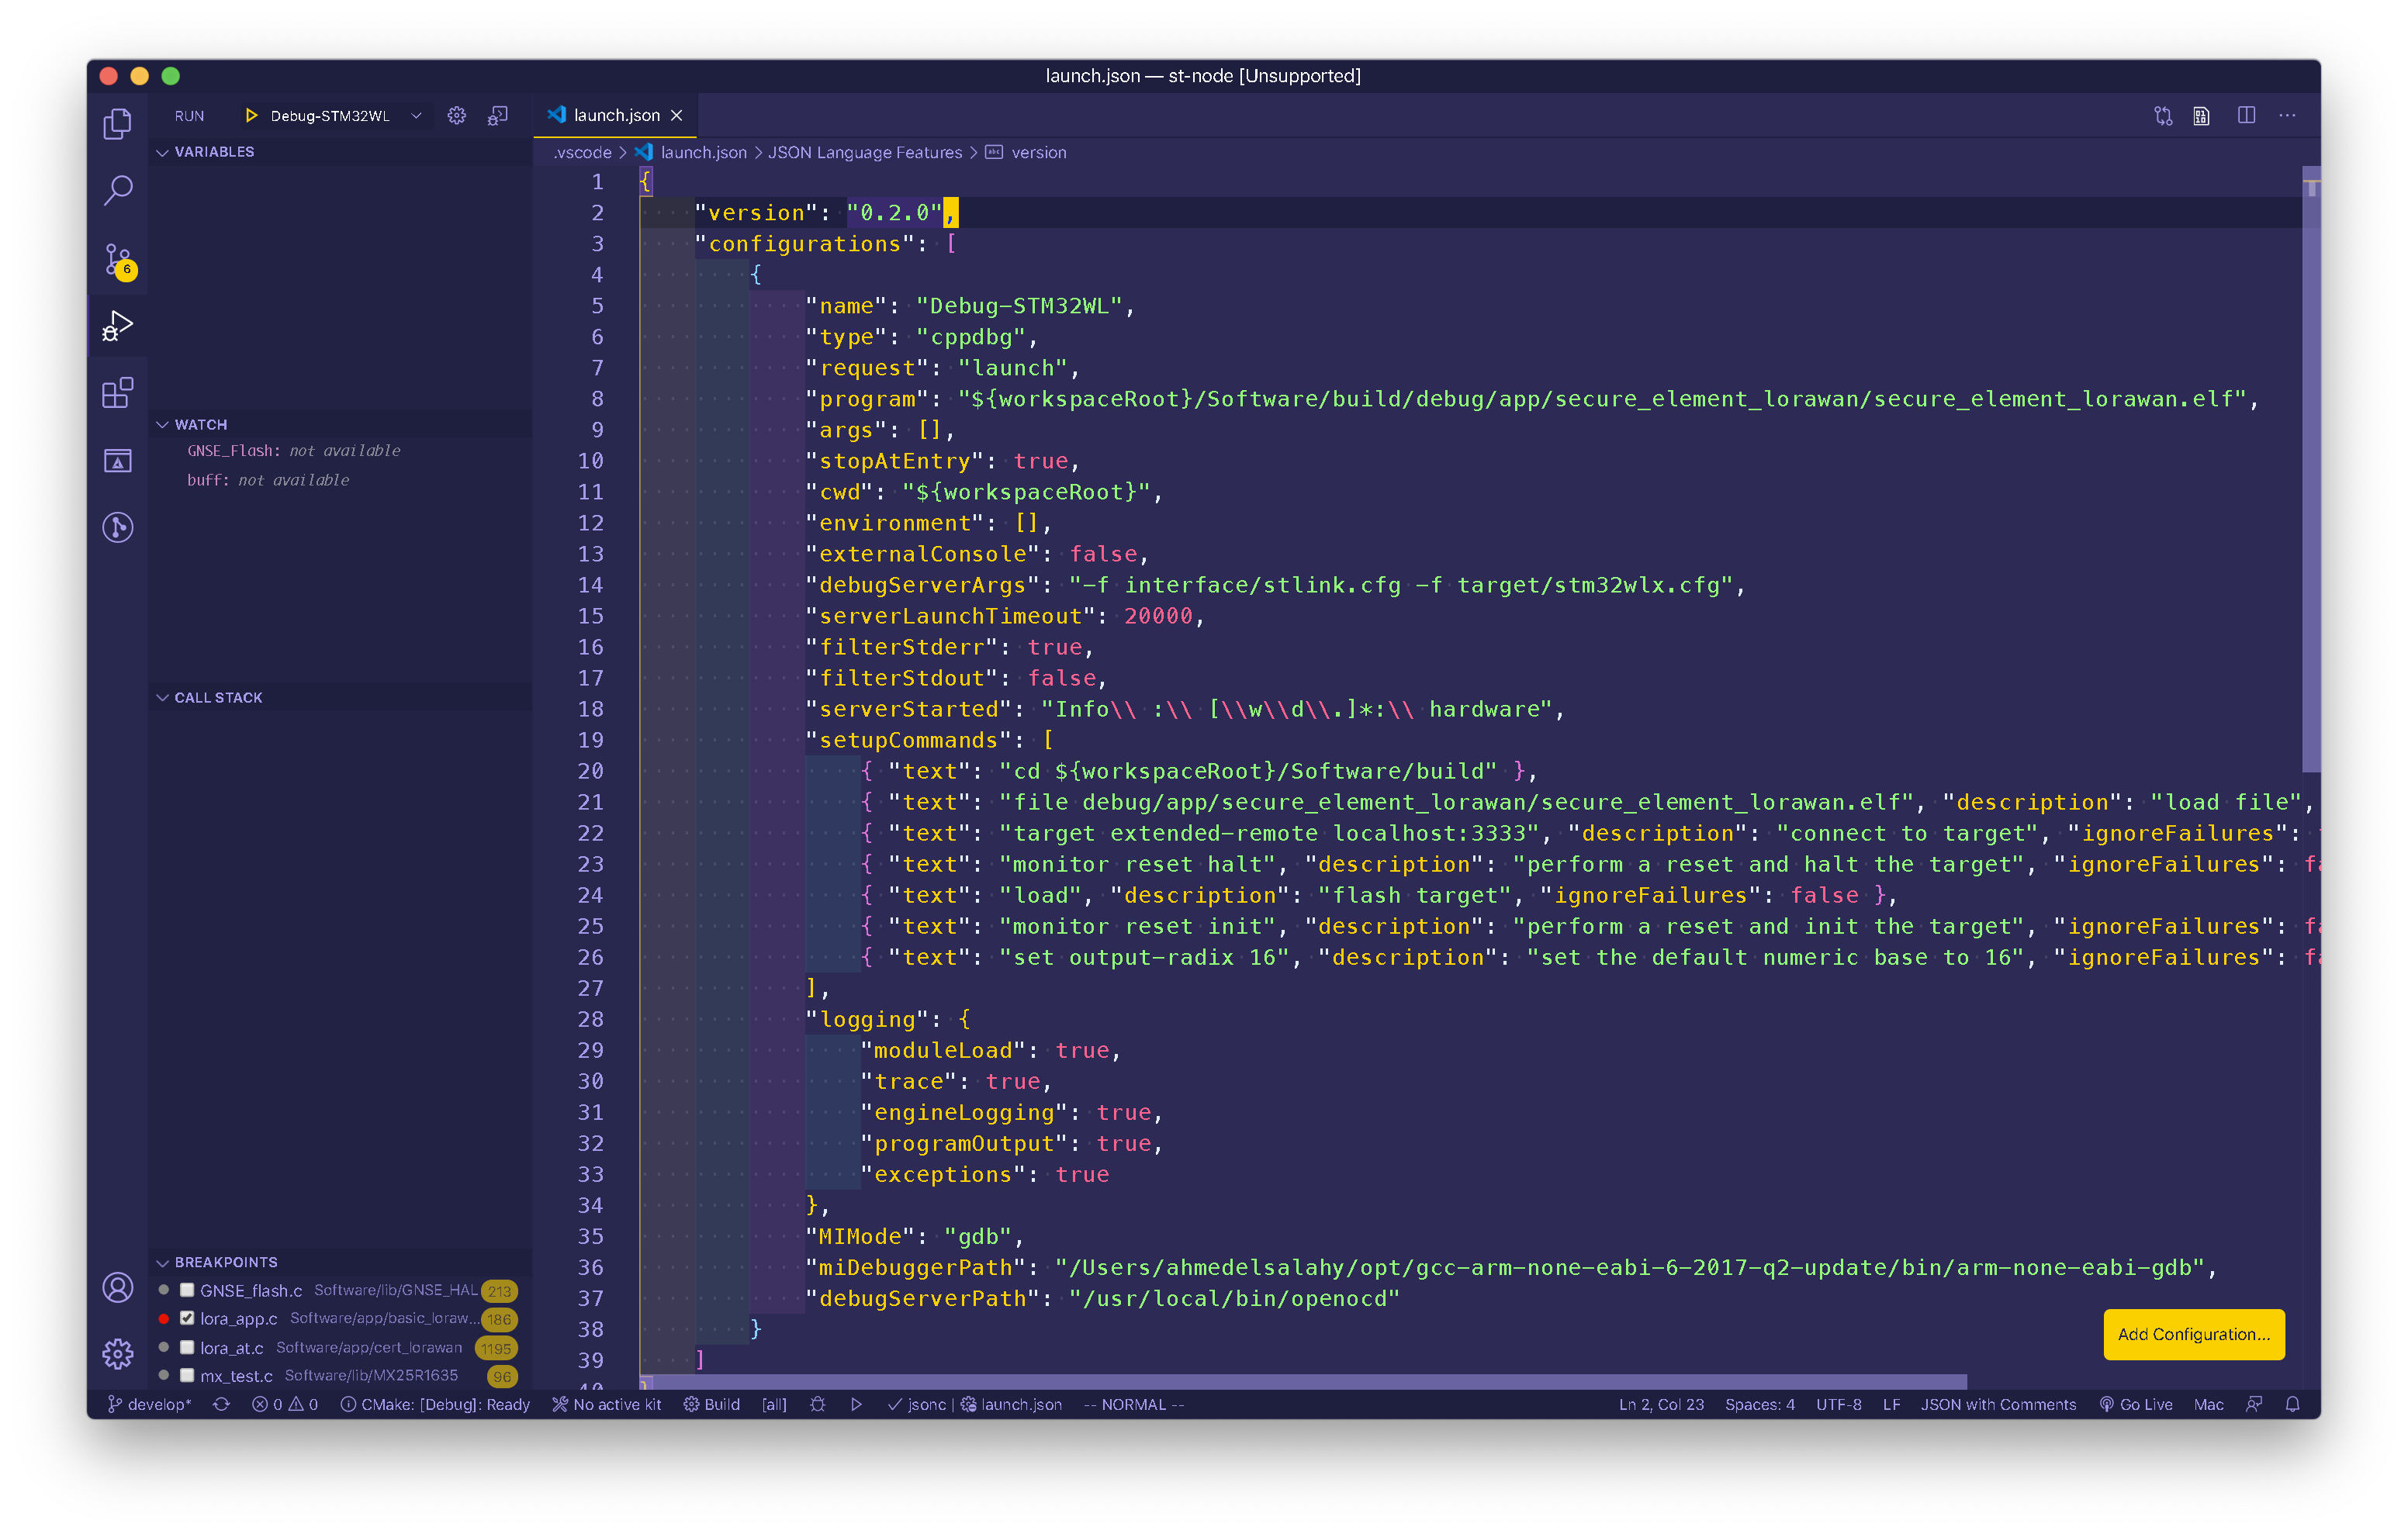
- You can now launch the flashing/debugging process using VSCode’s built-in debugger.